Mzansi Moneyball: Unpacking this SA20 Season

Most pieces like this start by burying you in numbers. We can do that. We will. But first, let’s do it like an action film: a cold open.
Last Sunday afternoon. SA20 Final. Four seasons in, the thing’s stopped feeling like a novelty and started feeling like a habit. Packed stands, overseas names, local heroes, and that little belief that no lead is safe because T20 doesn’t do manners.
Except this one. This lead looked locked. Sunrisers were 48/4 chasing 158, Tristan Stubbs was walking in short on runs, and you could hear the commentary tone shift from “if” to “how soon.” Start engraving Pretoria Capitals, they were basically saying, just pick the font.
Our in-house T20 win-probability model agreed. Built off the usual ingredients, venue, wickets lost, partnerships, run rates, it had Pretoria at 68% in that moment.
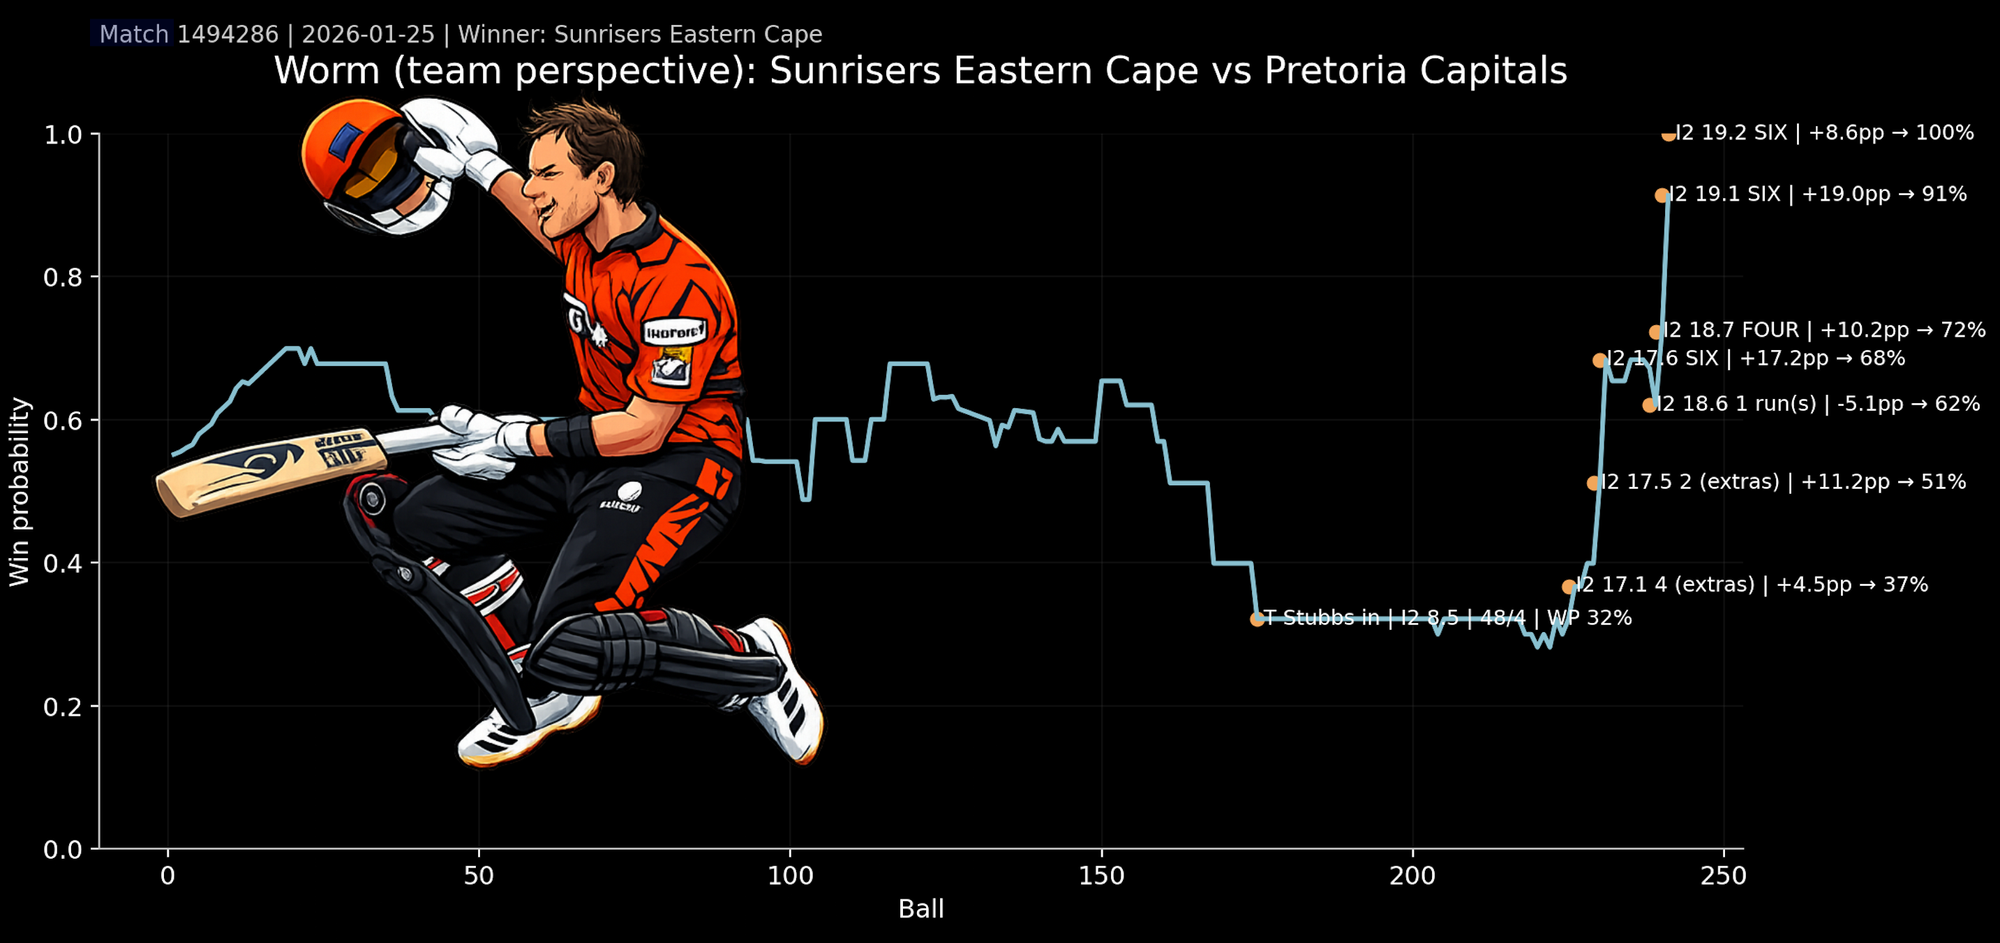
Yet, about an hour later, Stubbs was crunching sixes over midwicket to drag his side home. He finished on 63. He wasn’t even Man of the Match, yet his innings may have been worth R16m, the difference between second and first. It’s a neat, brutal reminder that in T20, not all runs are equal. And it’s what sent us back through the season with a scalpel.
Because this is where SimplyfAI lives. We build agentic workflows: small, reliable skills that fetch the ball-by-ball, clean it, sanity-check it, run the model, spit out the visuals, then rerun the whole pipeline the second reality changes. Cricket is perfect for that. The data is structured, the stakes swing every ball, and you can always check it against what you just watched on TV.
So if you were as into the SA20 as we were, sit back, and let’s answer the pressing questions with data.
Who Actually Won You Matches in SA20 25/26?
Step 1: Build a win-probability model (ball by ball)
The idea: “This guy will win us 3 matches”
If you listen to top T20 coaches (IPL included), you’ll hear this kind of talk all the time. Not “he averages 34”, but “he wins games”.
So we tried to measure that.
Instead of counting runs and wickets the usual way, we track something more “game-shaped”:
Win Probability Added (WPA)
How much did a player’s actions move their team towards winning, ball by ball?
We trained a machine learning model on the last three seasons (22/23–24/25) to answer:
Given the match situation right now, what’s the chance the batting team wins?
The model looks at match-state signals like:
- runs scored / runs required
- balls remaining
- wickets in hand
- current run rate vs required run rate (in chases)
- match phase (powerplay, middle, death)
- and context like venue/team priors (for stability in early overs)
It’s not “magic”. It’s basically a disciplined way of turning scoreboard context into a probability curve.
Step 2: Turn probabilities into “impact” (WPA)
Once you can estimate win probability before a ball and after the next legal ball, you can measure the swing:
- wp_before / wp_after: calibrated probability without shrinkage (event-driven)
- wpa = wp_after − wp_before (the swing caused by that ball’s outcome)
Big WPA moments are the ones you feel as a fan:
- a wicket in a chase when the required rate is climbing
- a boundary that breaks the back of the equation
- a dot ball at the death that tightens the screws
To avoid early-overs noise dominating everything, we damp early balls when we sum up season totals:
- wpa_adj = wpa × alpha
- where alpha = clip(legal_balls_before / shrinkage_balls, 0, 1)

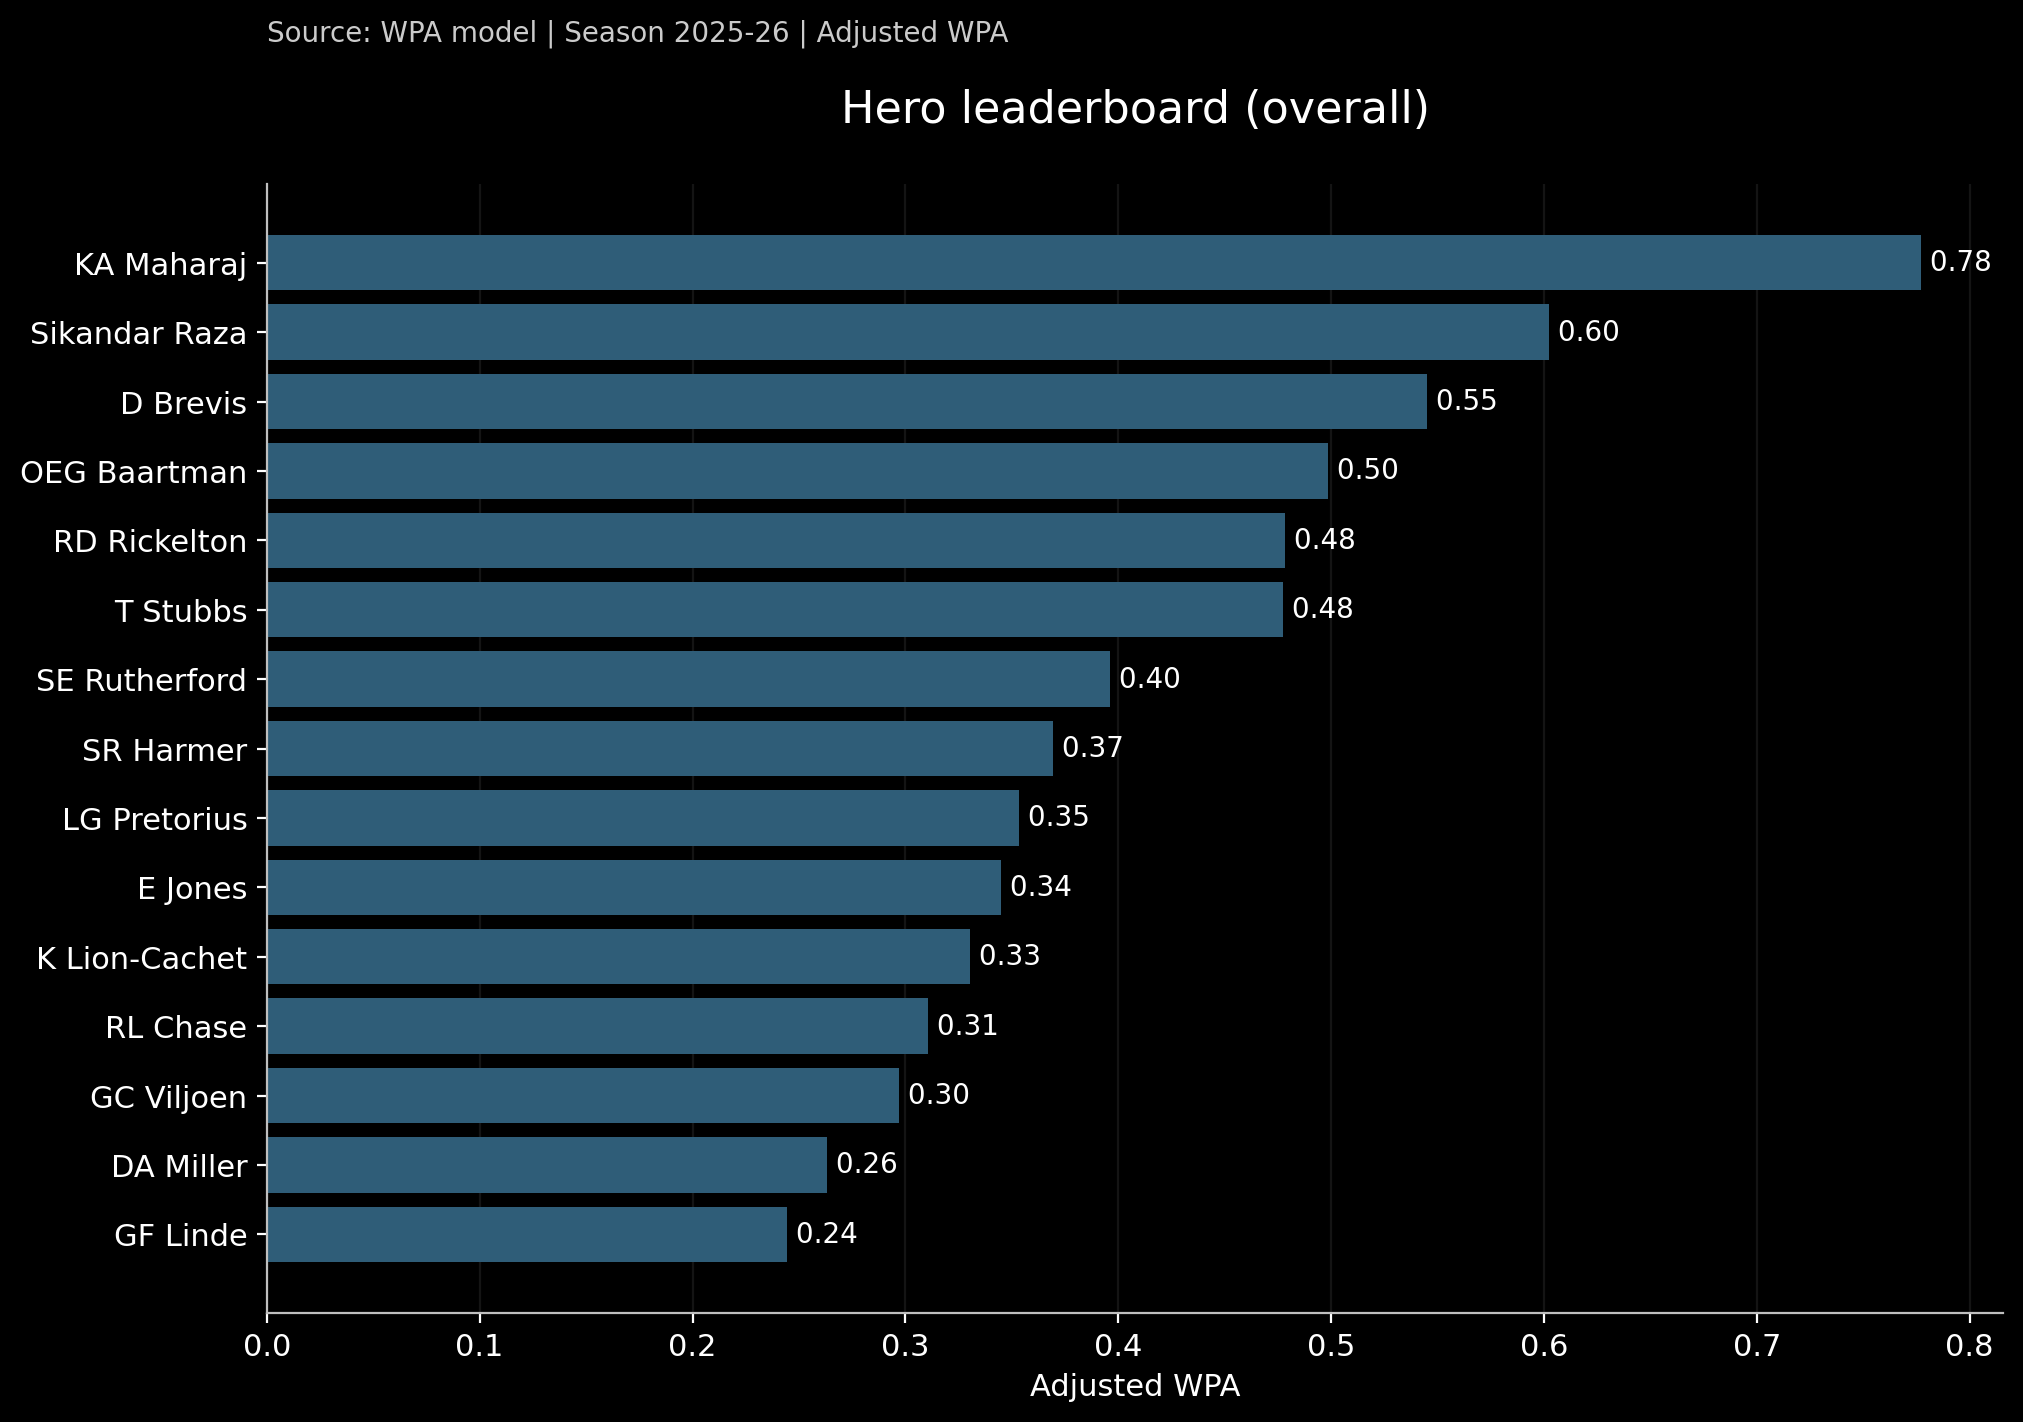
Results: SA20 25/26 MVP (WPA-based)
One important caveat before we get carried away: WPA isn’t perfect, and it’s not meant to be read in isolation.
Think of it like strike rate. A strike rate of 160 off 60 balls means something very different to 160 off 10. Same with WPA. A player putting up +0.50 WPA across 100 deliveries is a far more dependable signal than +0.50 across 10, even if the headline number looks identical.
And because WPA is event-driven, it can get spiky. A couple of massive moments, a late over swing, a dropped catch that turns into a six, can inflate someone’s season line. You’ll see that in the graphics: a few players are riding a handful of big events. That doesn’t make the metric “wrong” it just tells you what it’s measuring, and what it isn’t.
Overall MVP impact
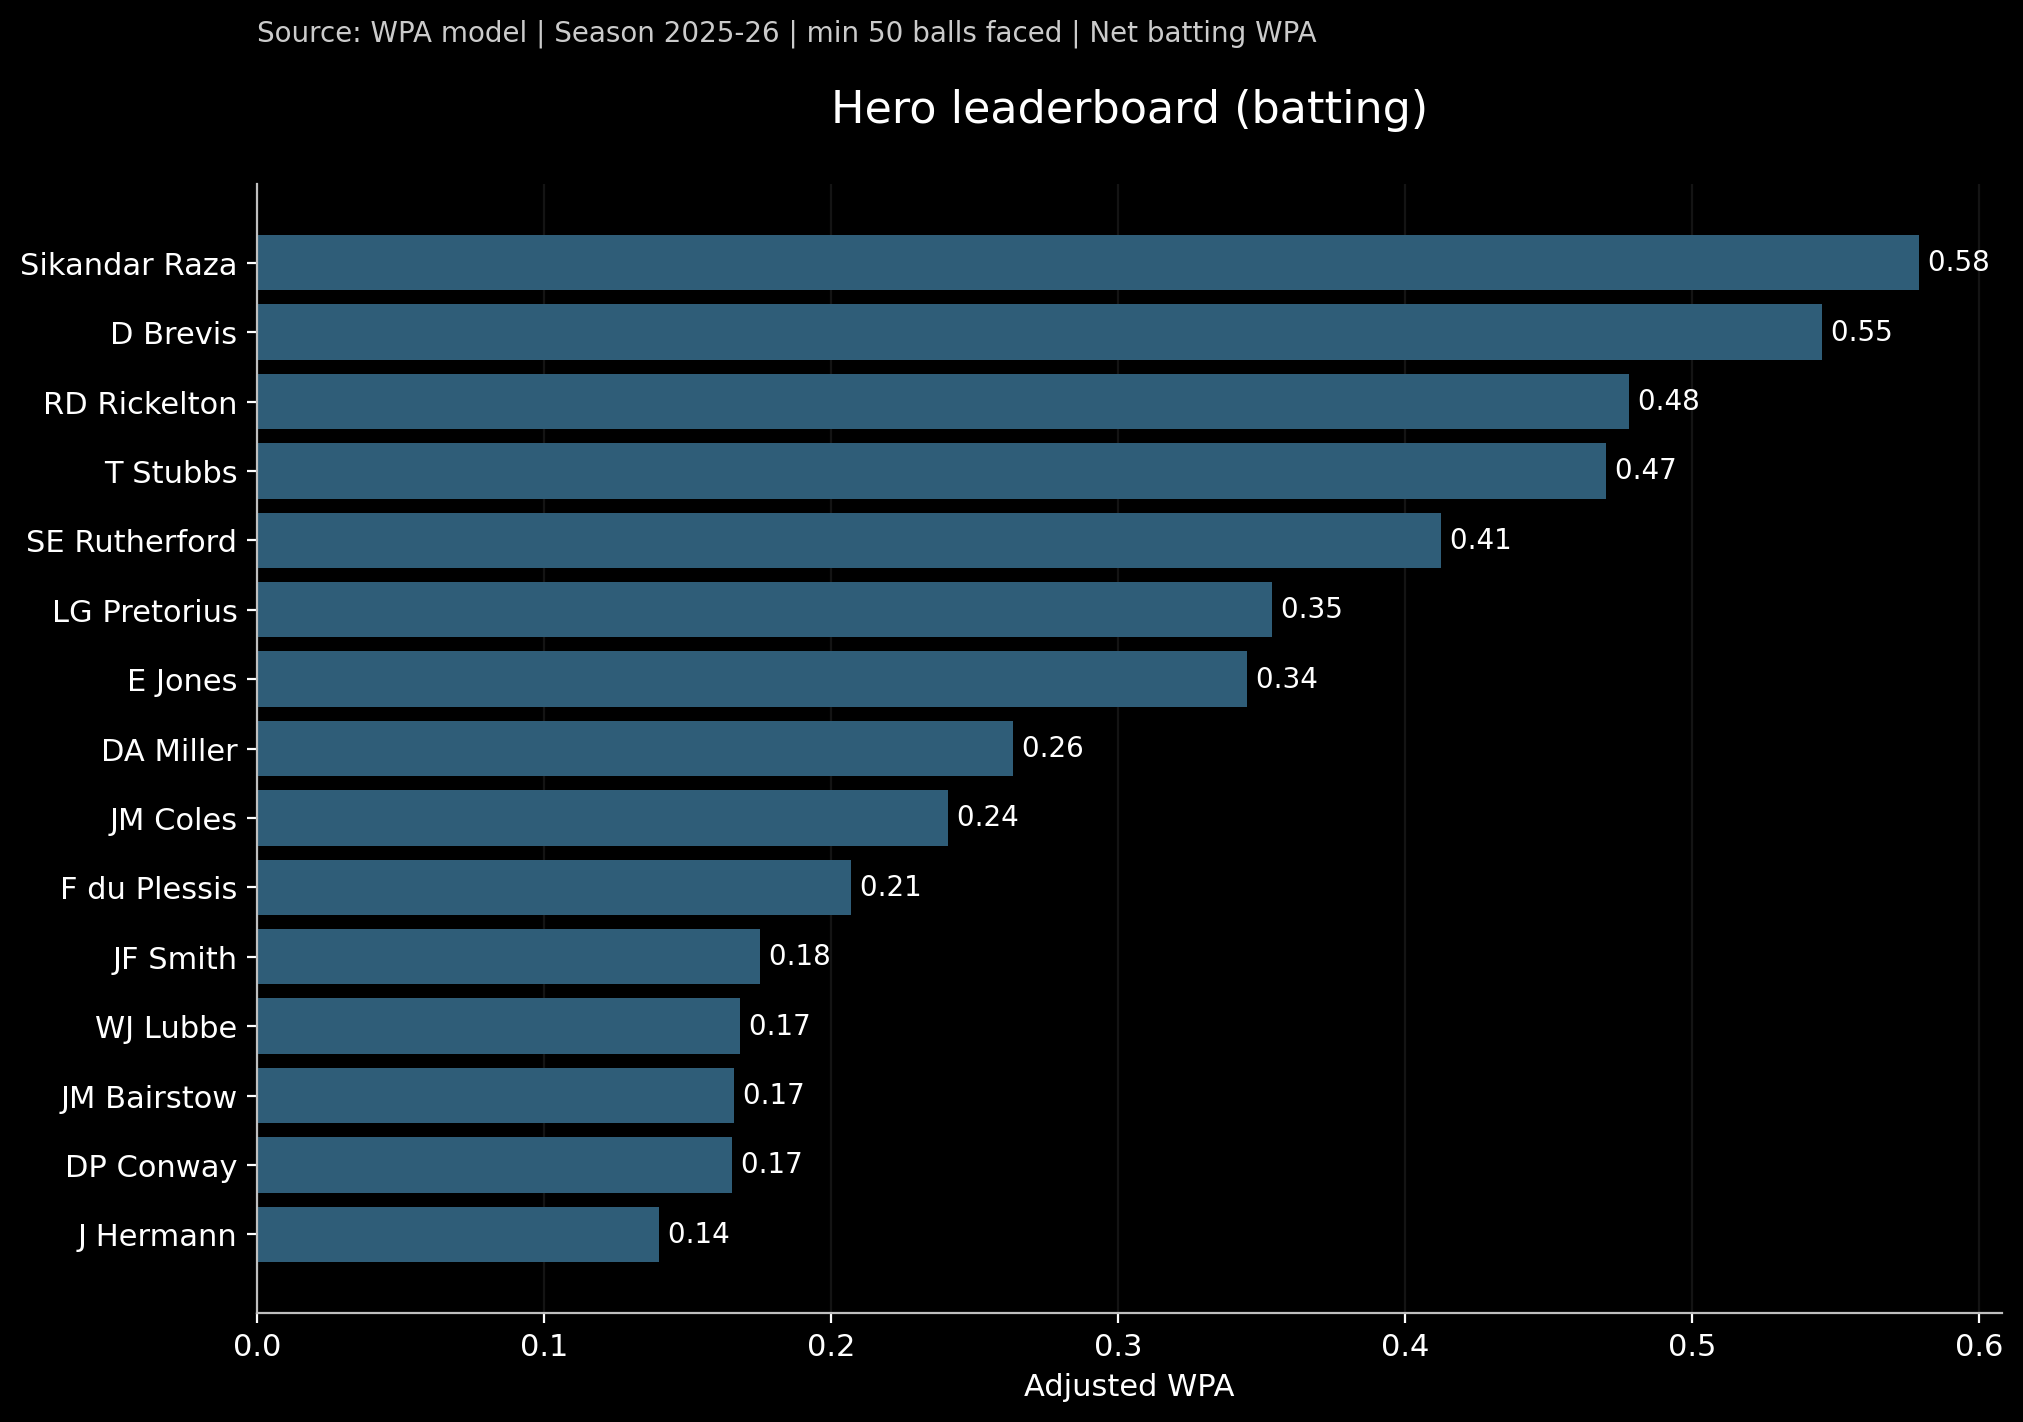
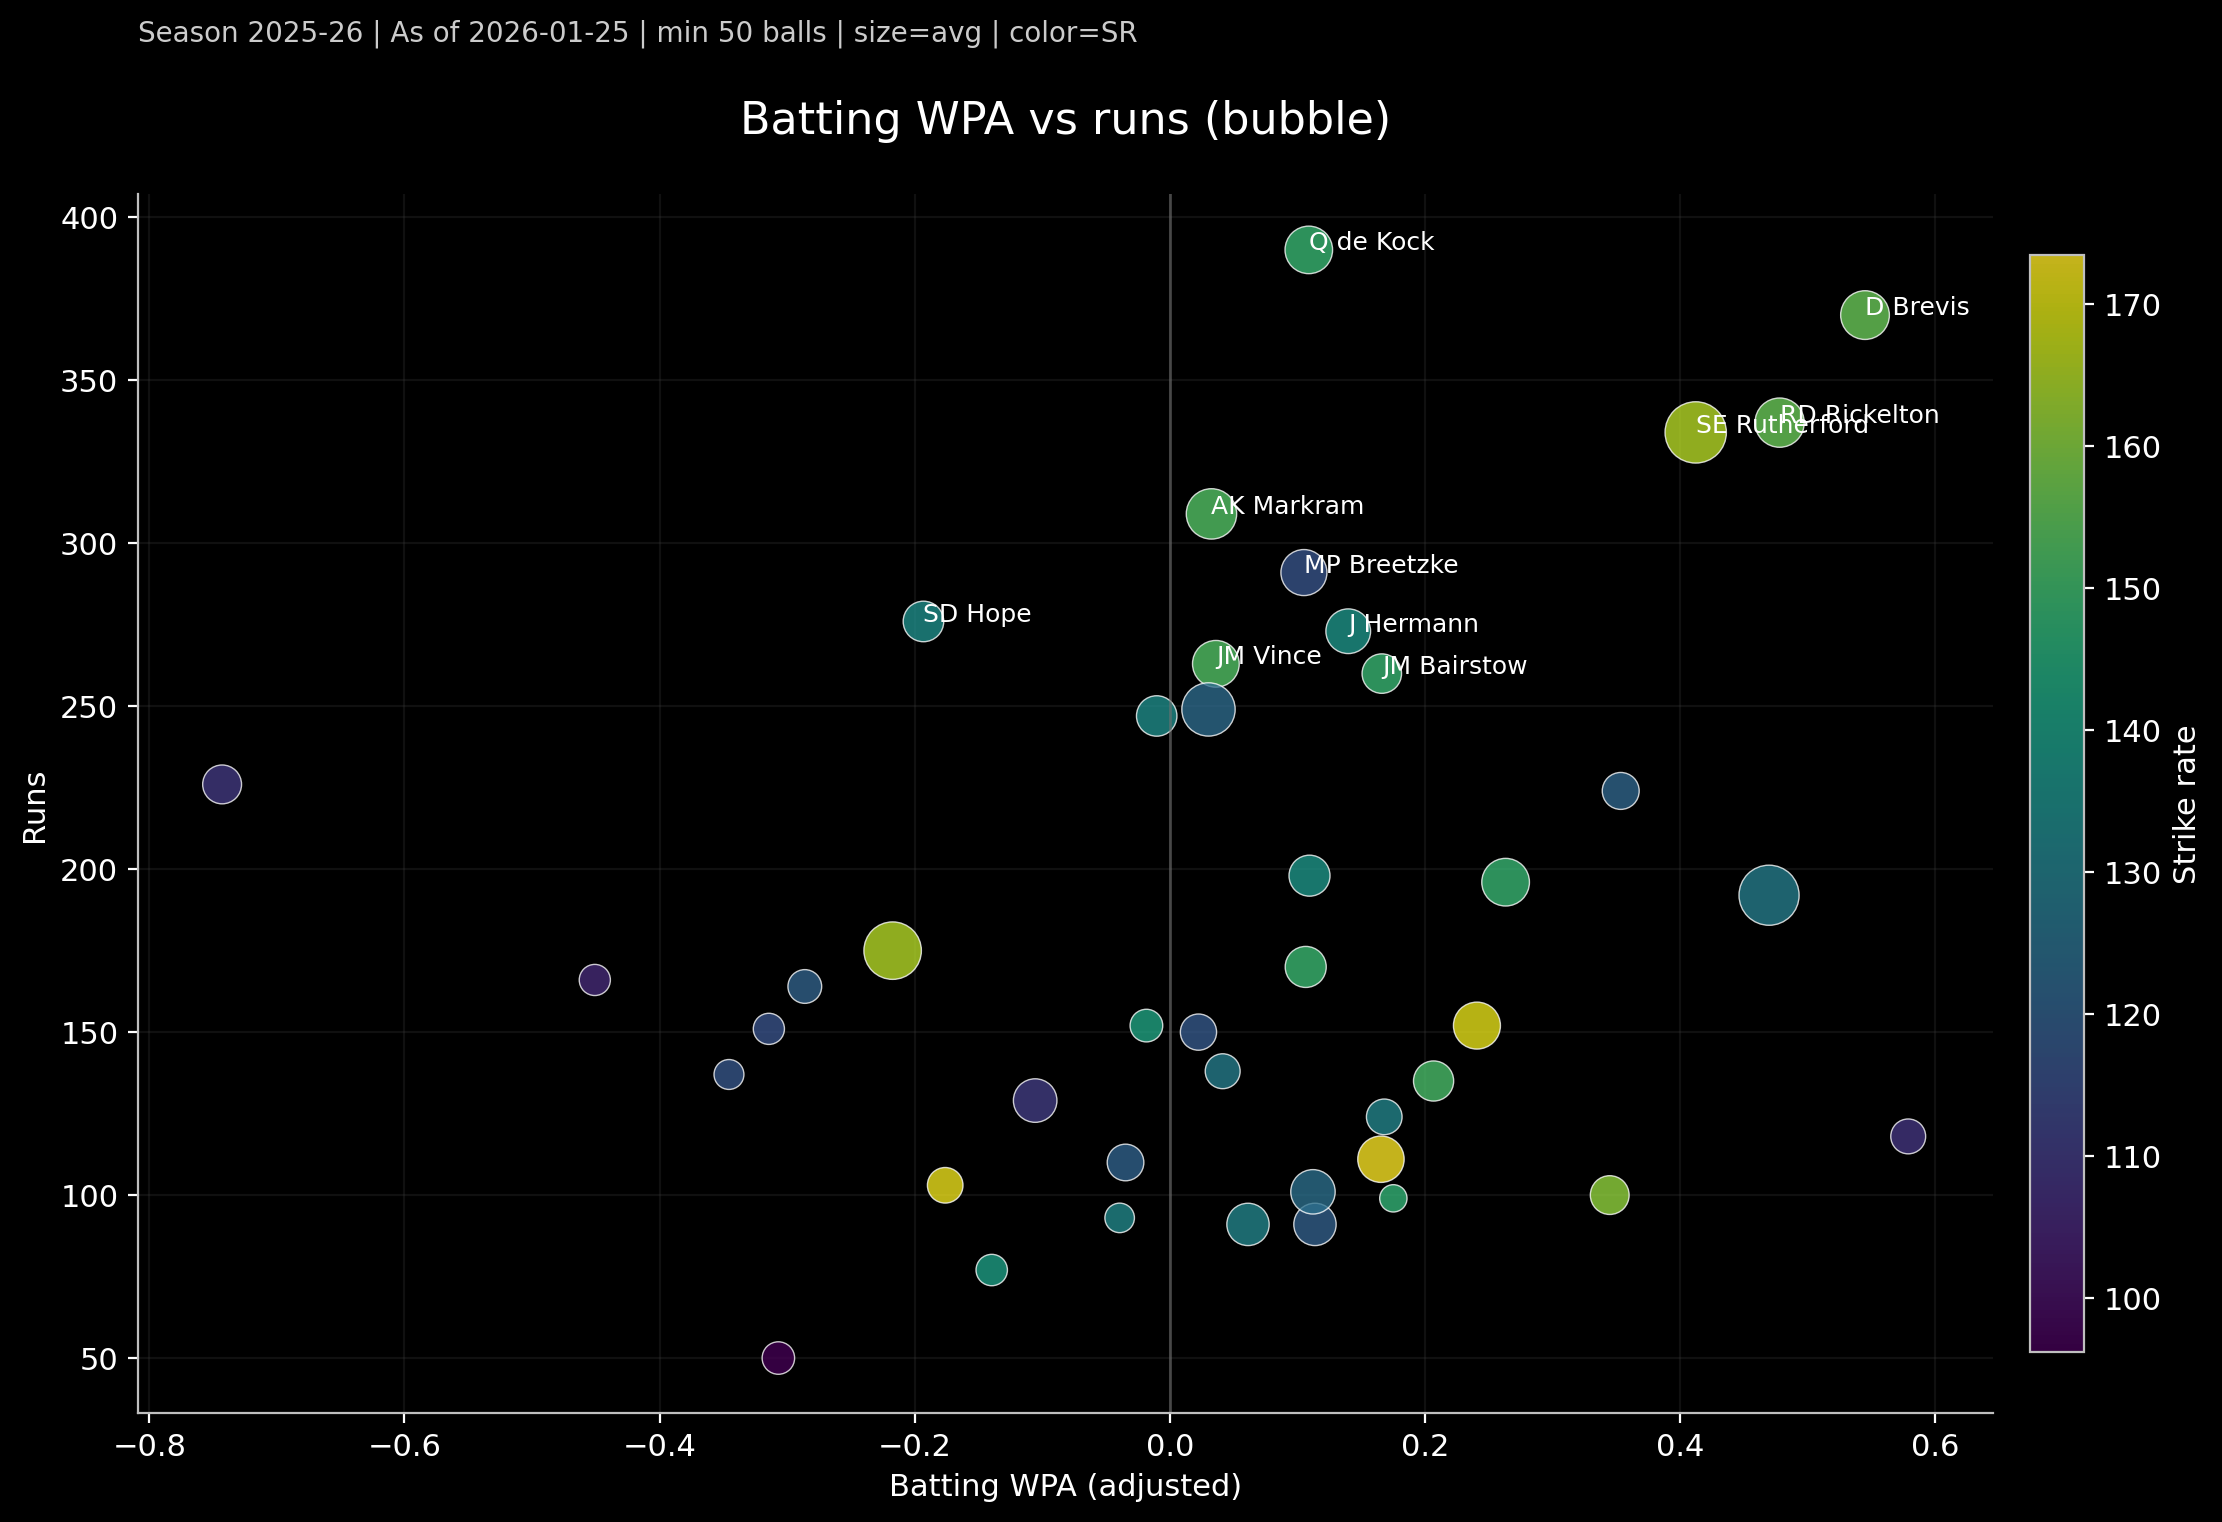
Top batters by WPA impact
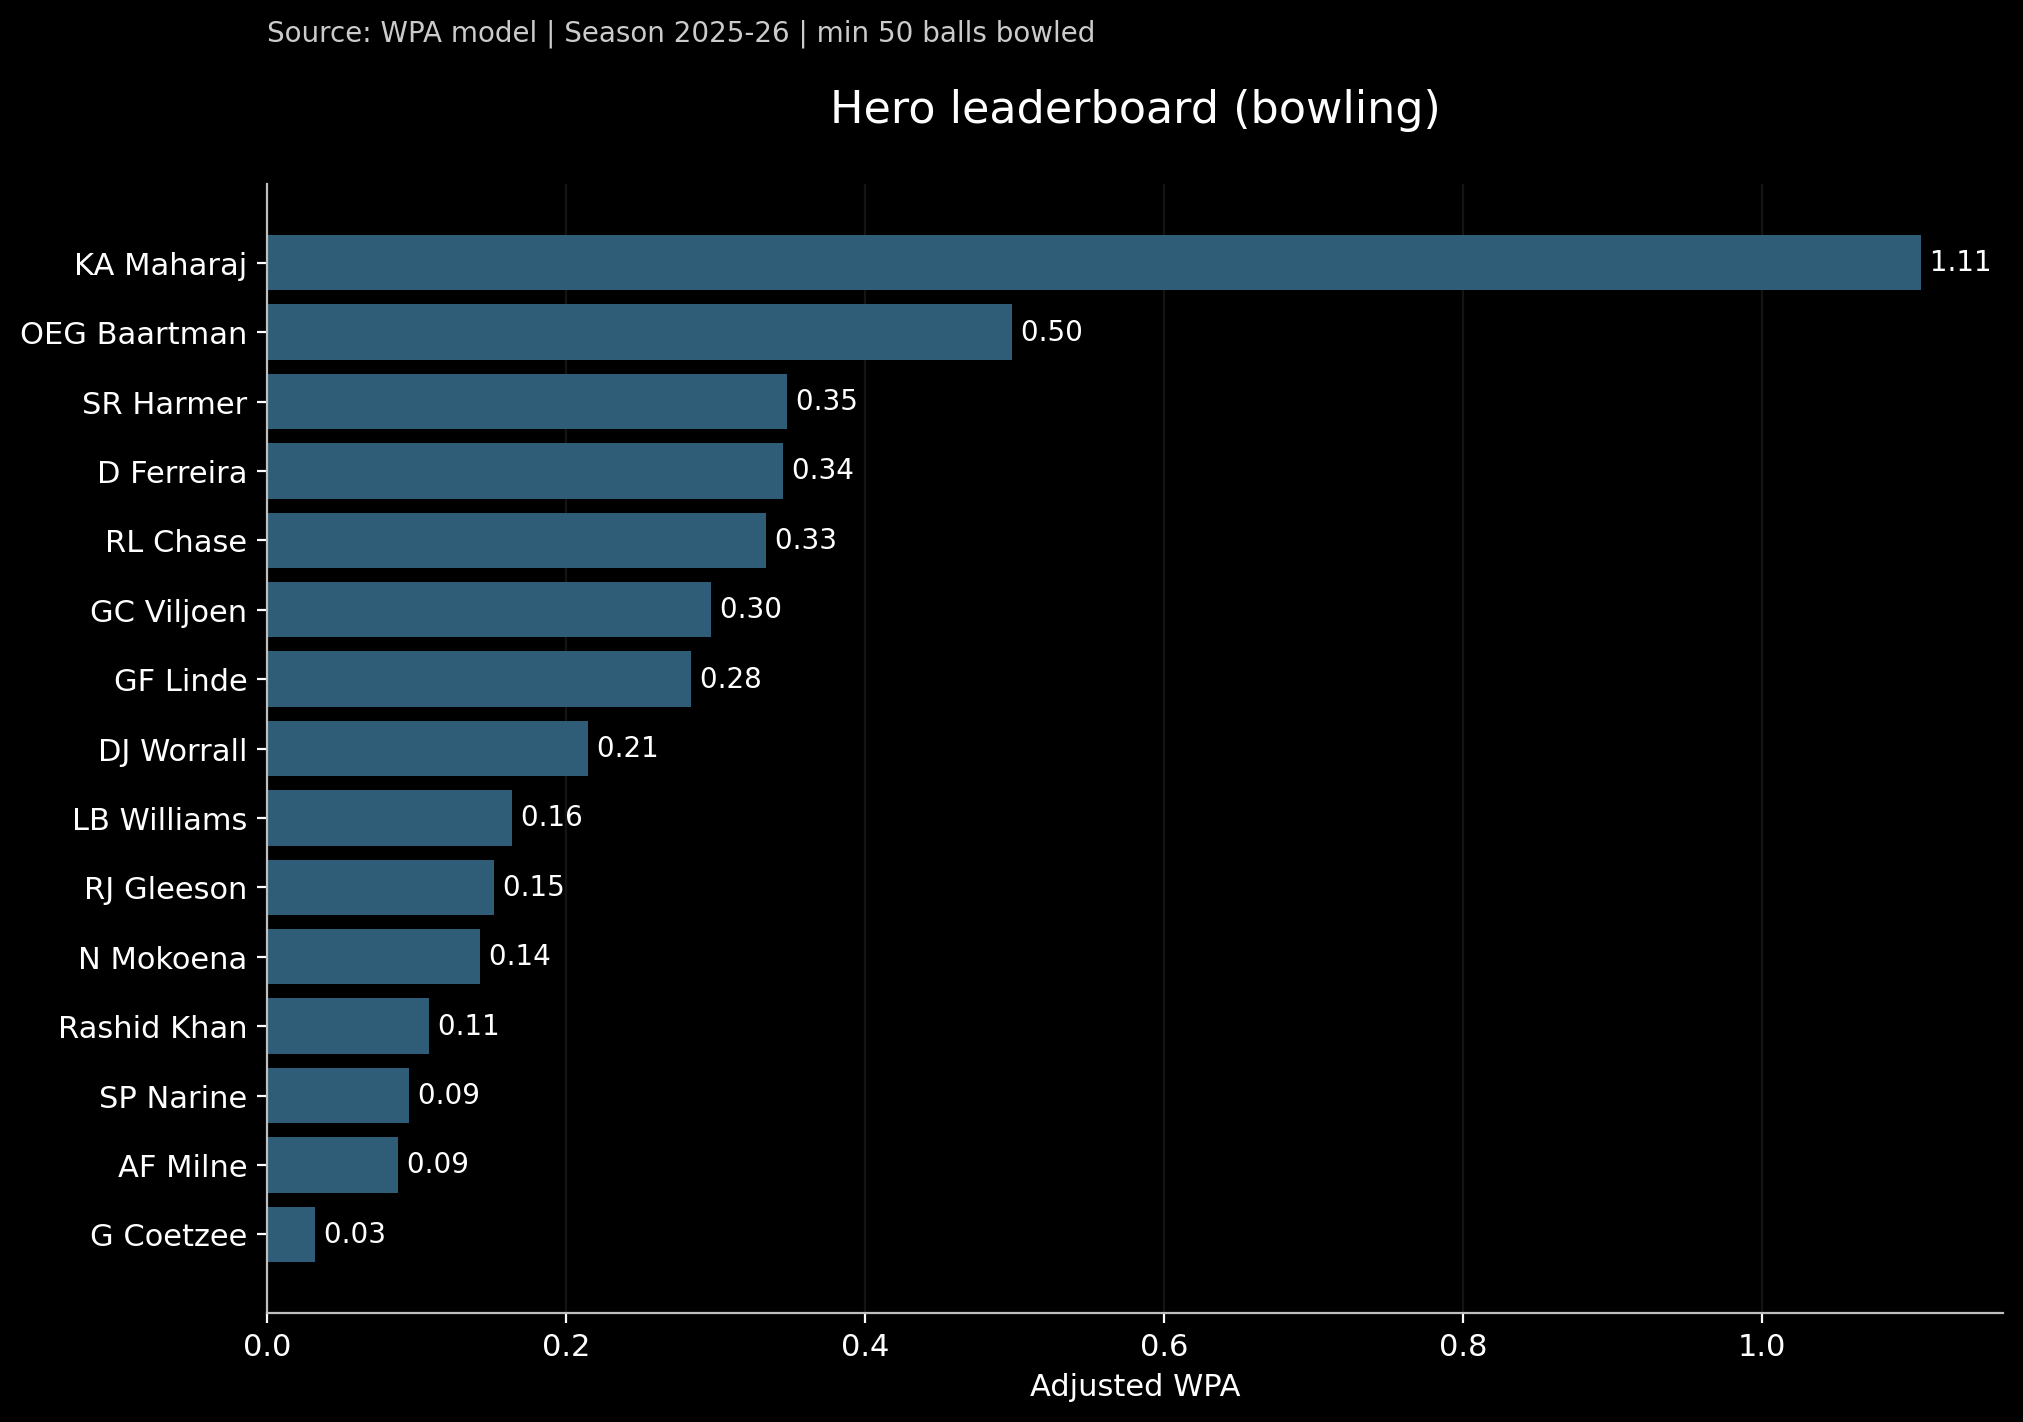
Top bowlers by WPA impact
“Pressure” is where reputations get made
We also tag pressure balls as the top slice of biggest absolute swings. Then we can ask:
- Who consistently shows up when the game is hot?
- Who is farming impact when it matters?
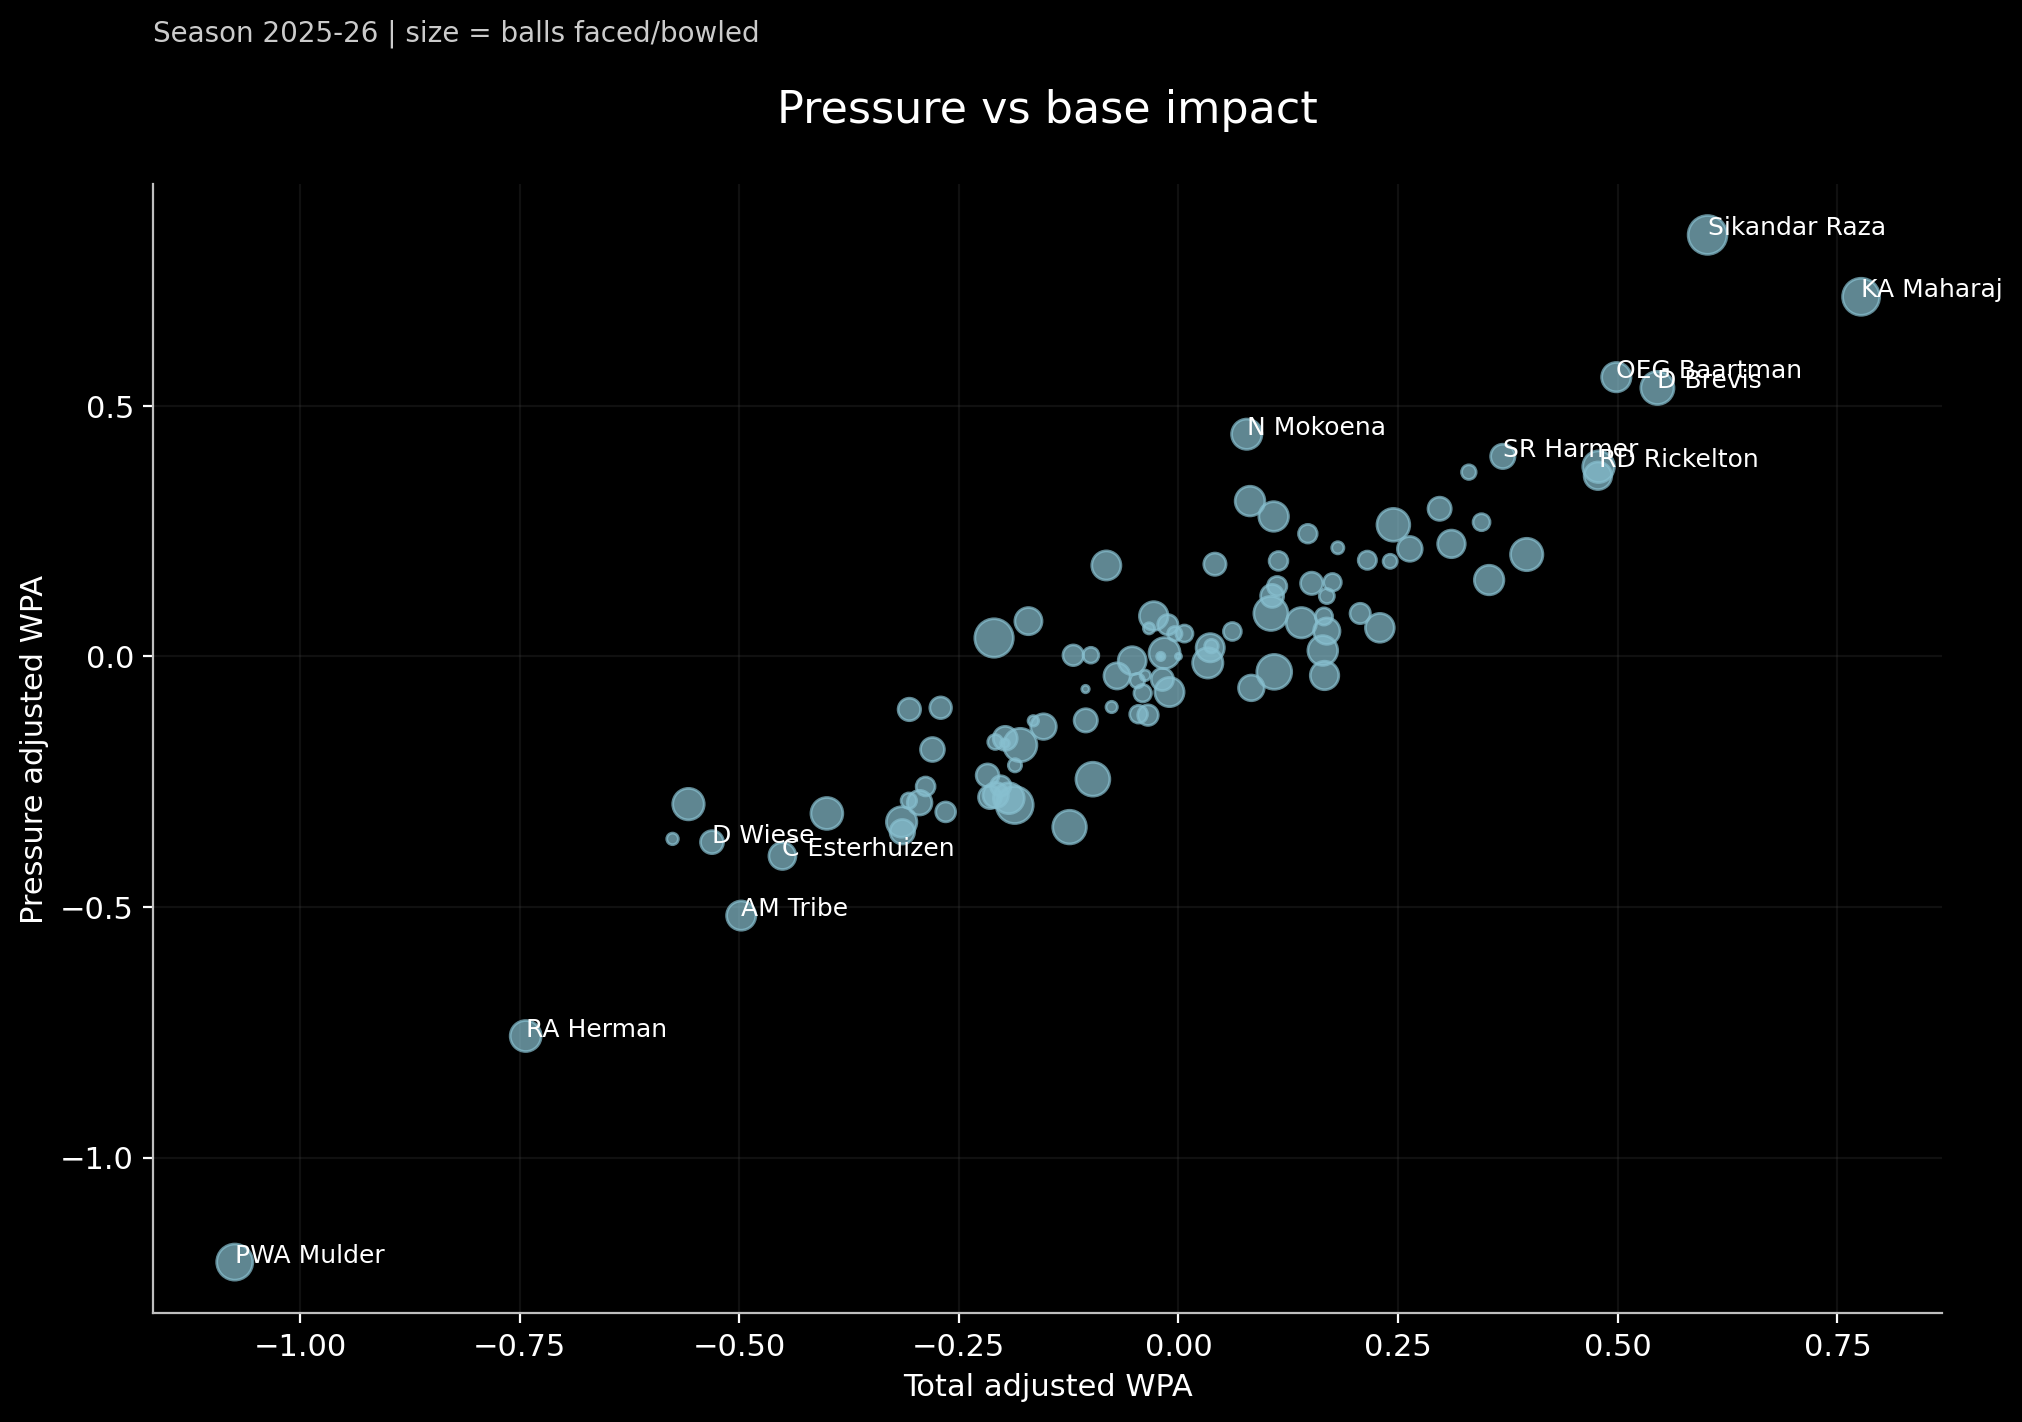
Augmenting the WPA Analysis
These two charts (below) are a quick way to keep WPA honest. Win Probability Added captures context (how much each ball moved the game), but it can be noisy if you stare at it on its own. So we plot it alongside the blunt, season-long outputs: runs and wickets, then layer in the quality signals like strike rate and averages. The point isn’t to crown a single “best” number, it’s to see who paired match-turning moments with repeatable volume, and who’s being lifted by a handful of spikes.
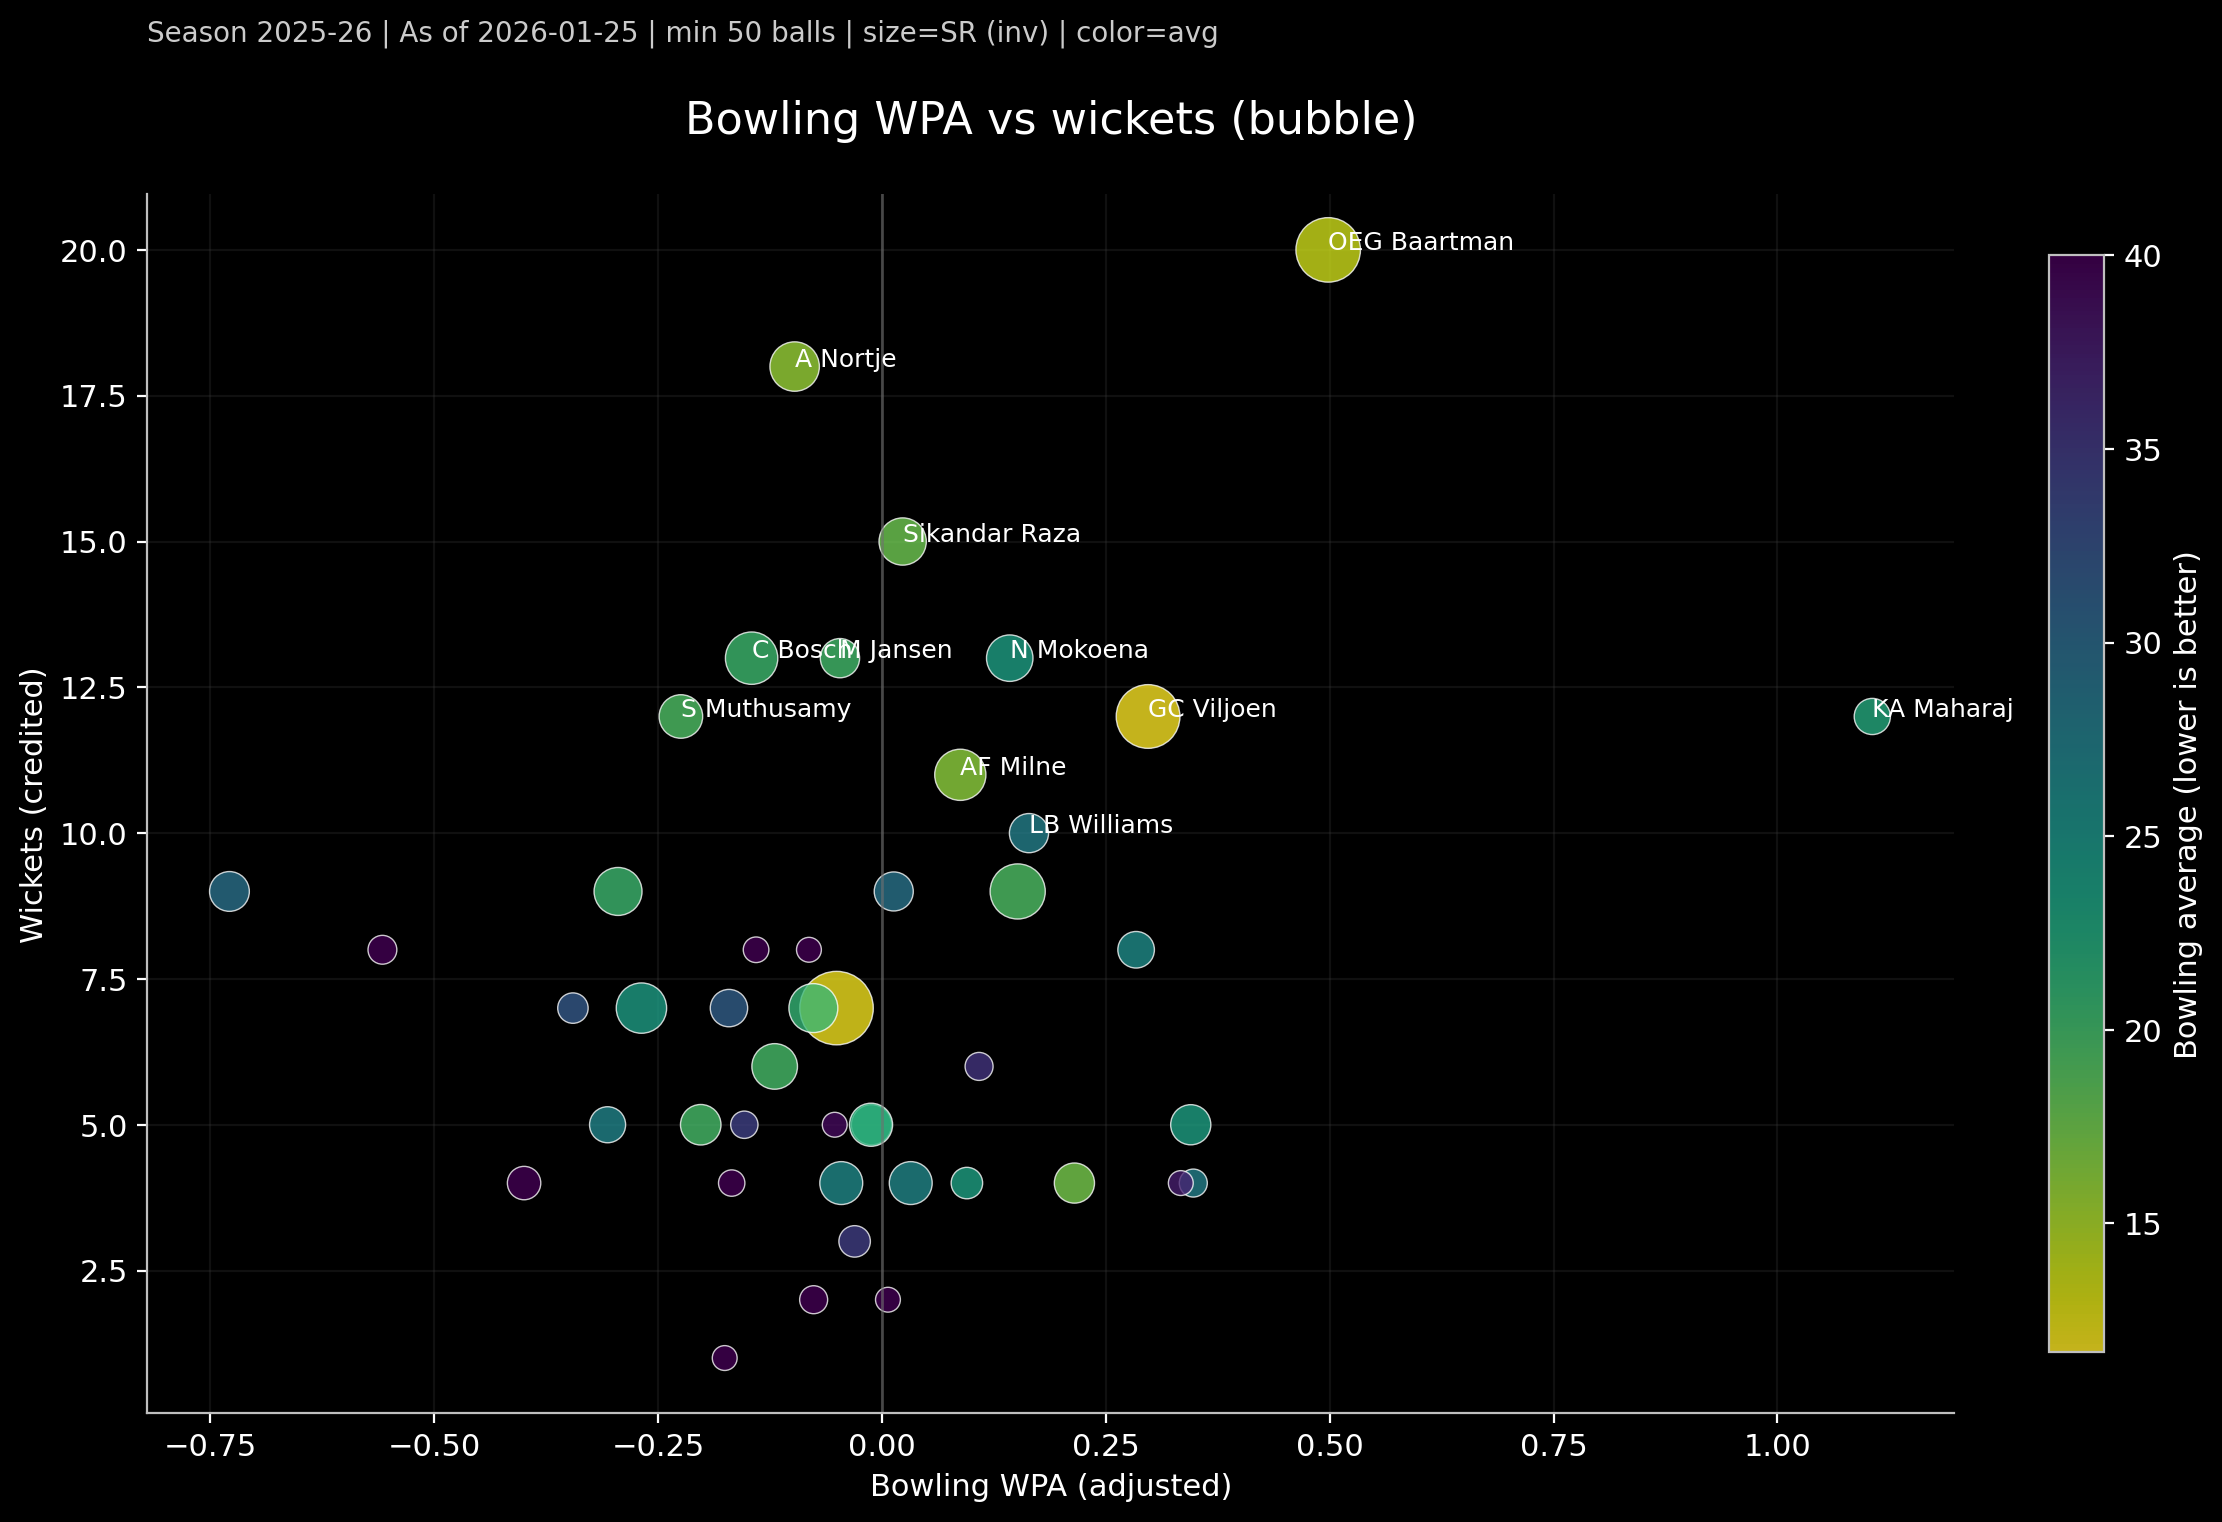
It’s also worth noting that when a bowler operates can skew their WPA. The phase matters. A powerplay specialist has fewer “easy” leverage moments to cash in, so strong WPA there is especially meaningful. In the graphic below, Marco Jansen stands out as hugely valuable in the Powerplay, a period where it’s typically harder for bowlers to materially swing a game.
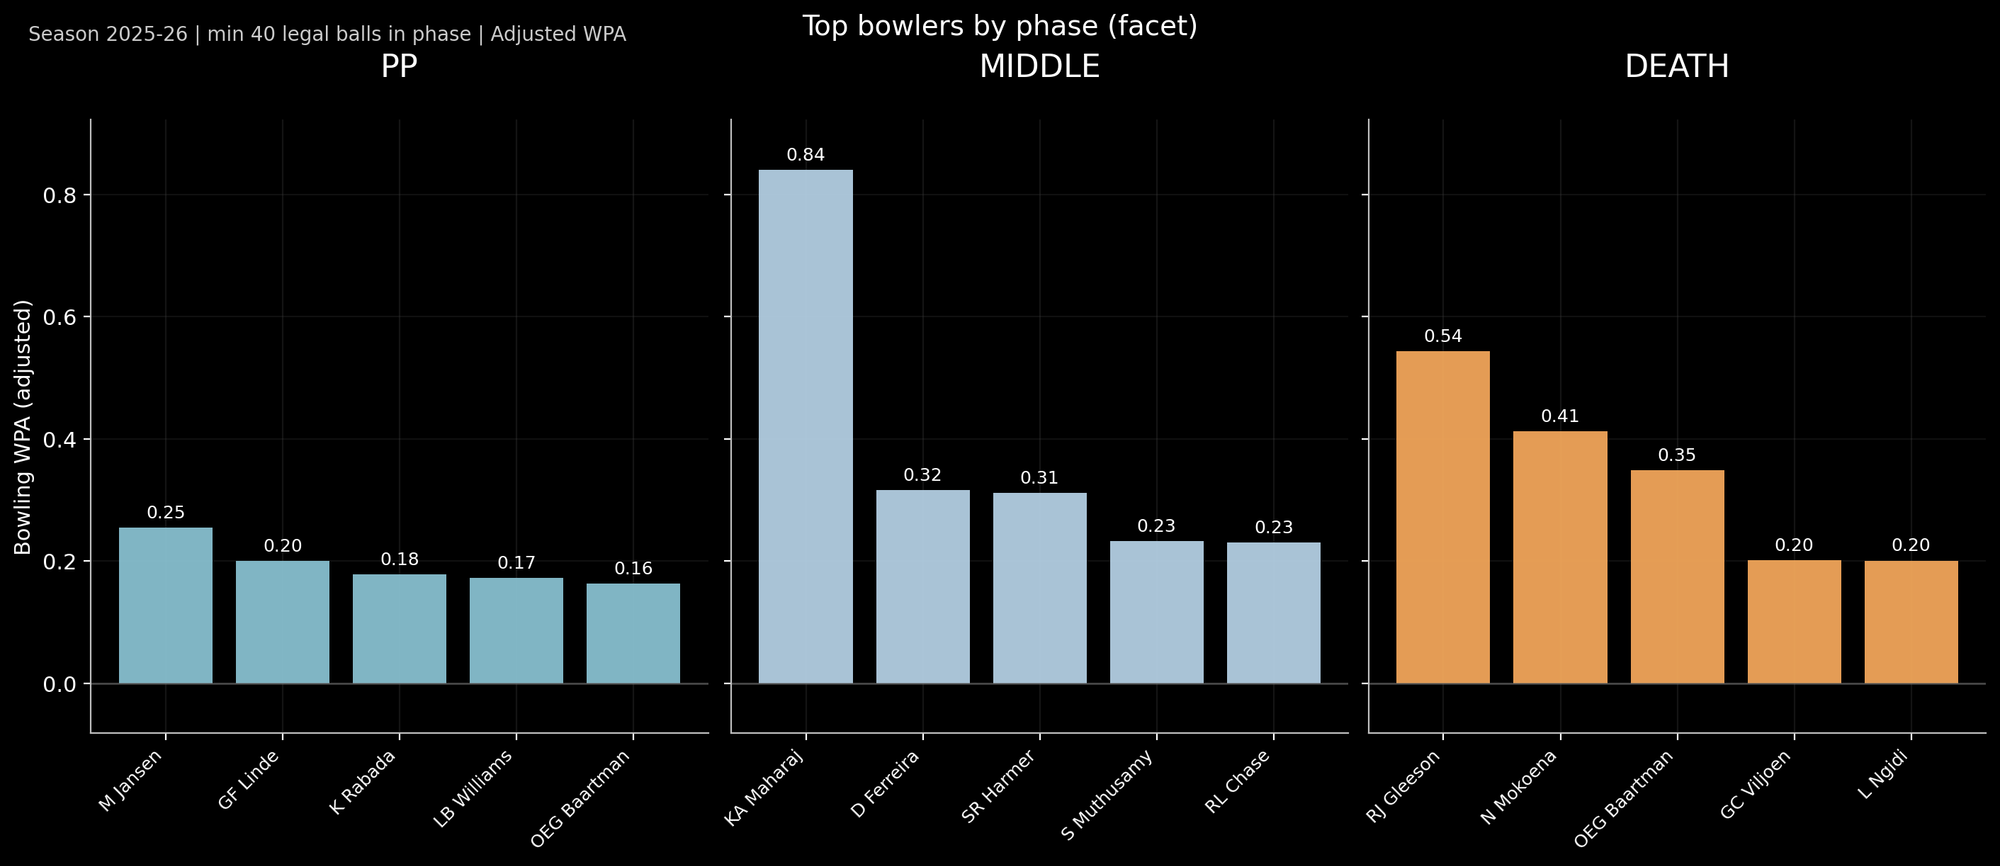
Interestingly, the graphic above also highlights how important spinners are in the middle overs and having two of them in your team (regardless of the conditions) is a superpower.
Where did it go so wrong for MI Cape Town?
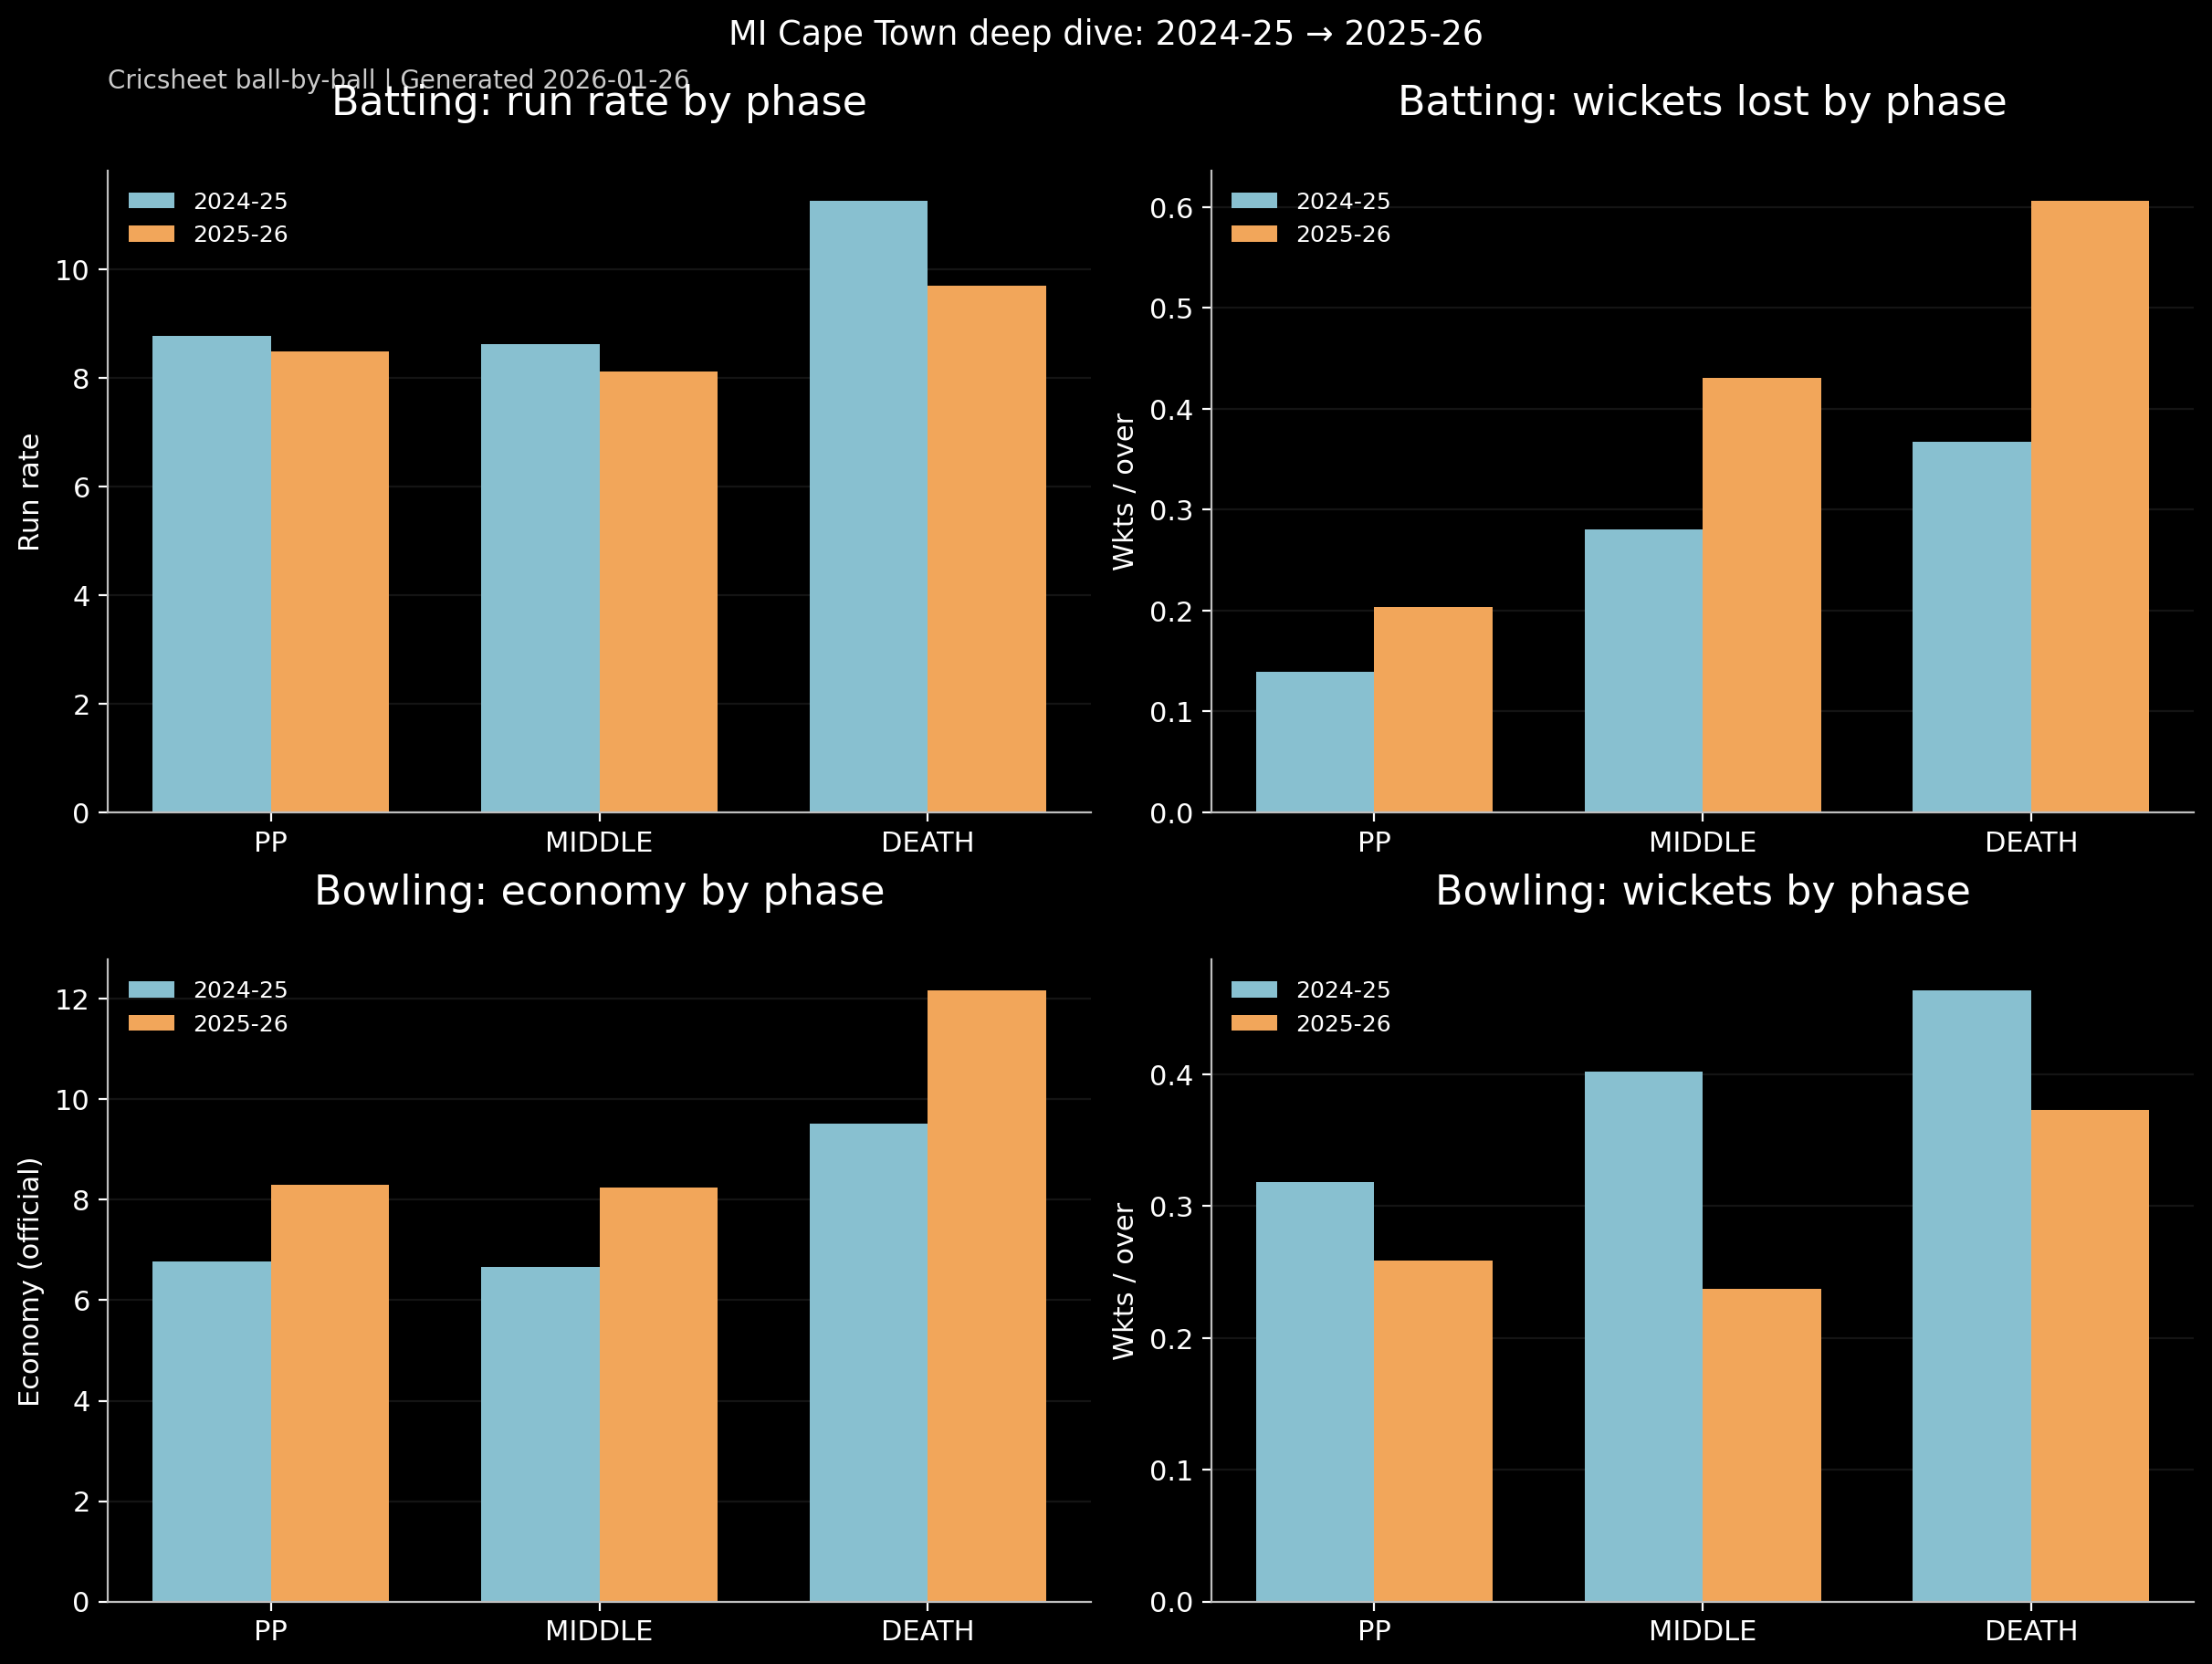
A pressing question this season is how MI Cape Town fell off after being champions last season and, interestingly, it parallels a lot of what we’ve been unpacking with WPA: the death overs don’t just feel decisive, they keep showing up as the place where matches get stolen or secured. And for MI Cape Town, the story is brutally consistent across both lenses. Strip away the win-probability math and the basics still point to the same culprit: they’ve been losing the endgame on both sides of the ball.
Start with the phase breakdown: their batting has lost its late punch and it’s getting riskier at the same time, slower finishes and more wickets falling in the closing overs. On the bowling side, the trend is even more unforgiving: they’ve gone from controlling the death to haemorrhaging runs there, without the wicket-taking to bail them out.
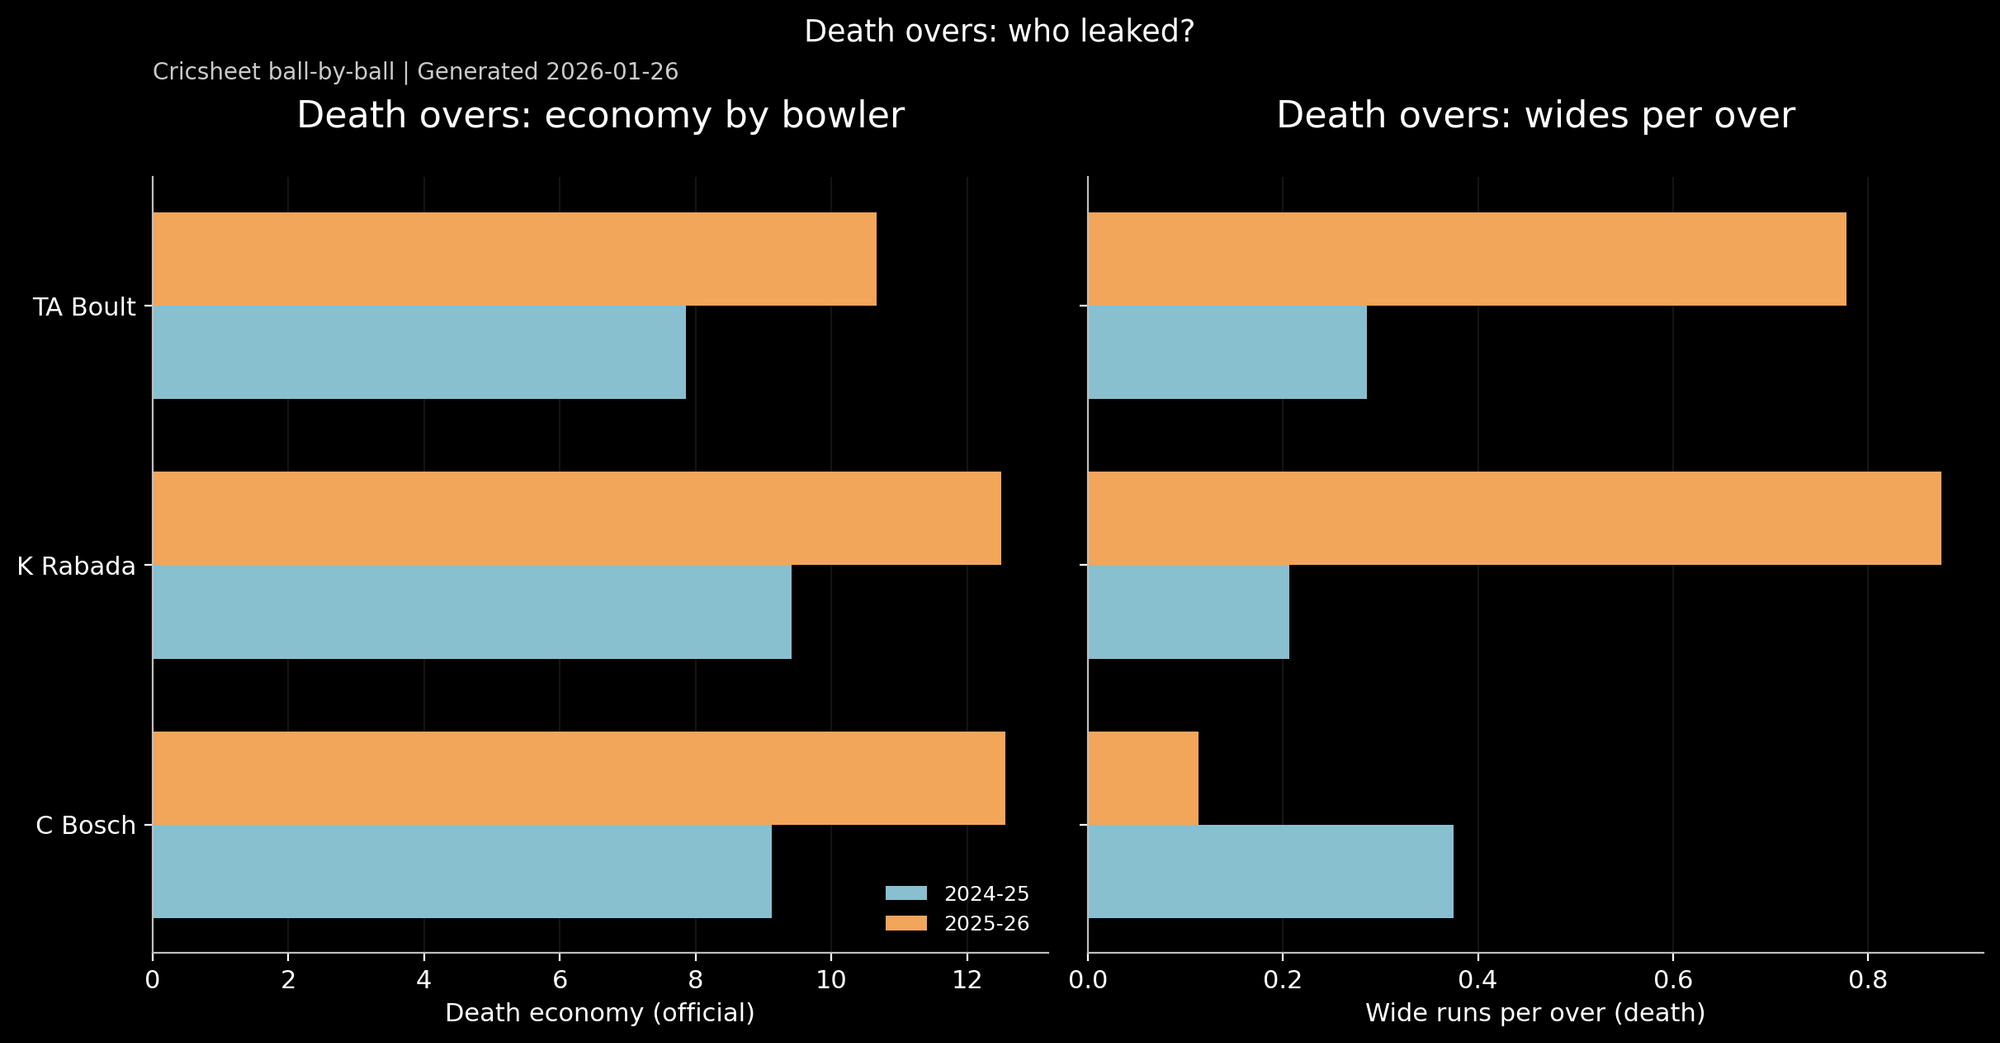
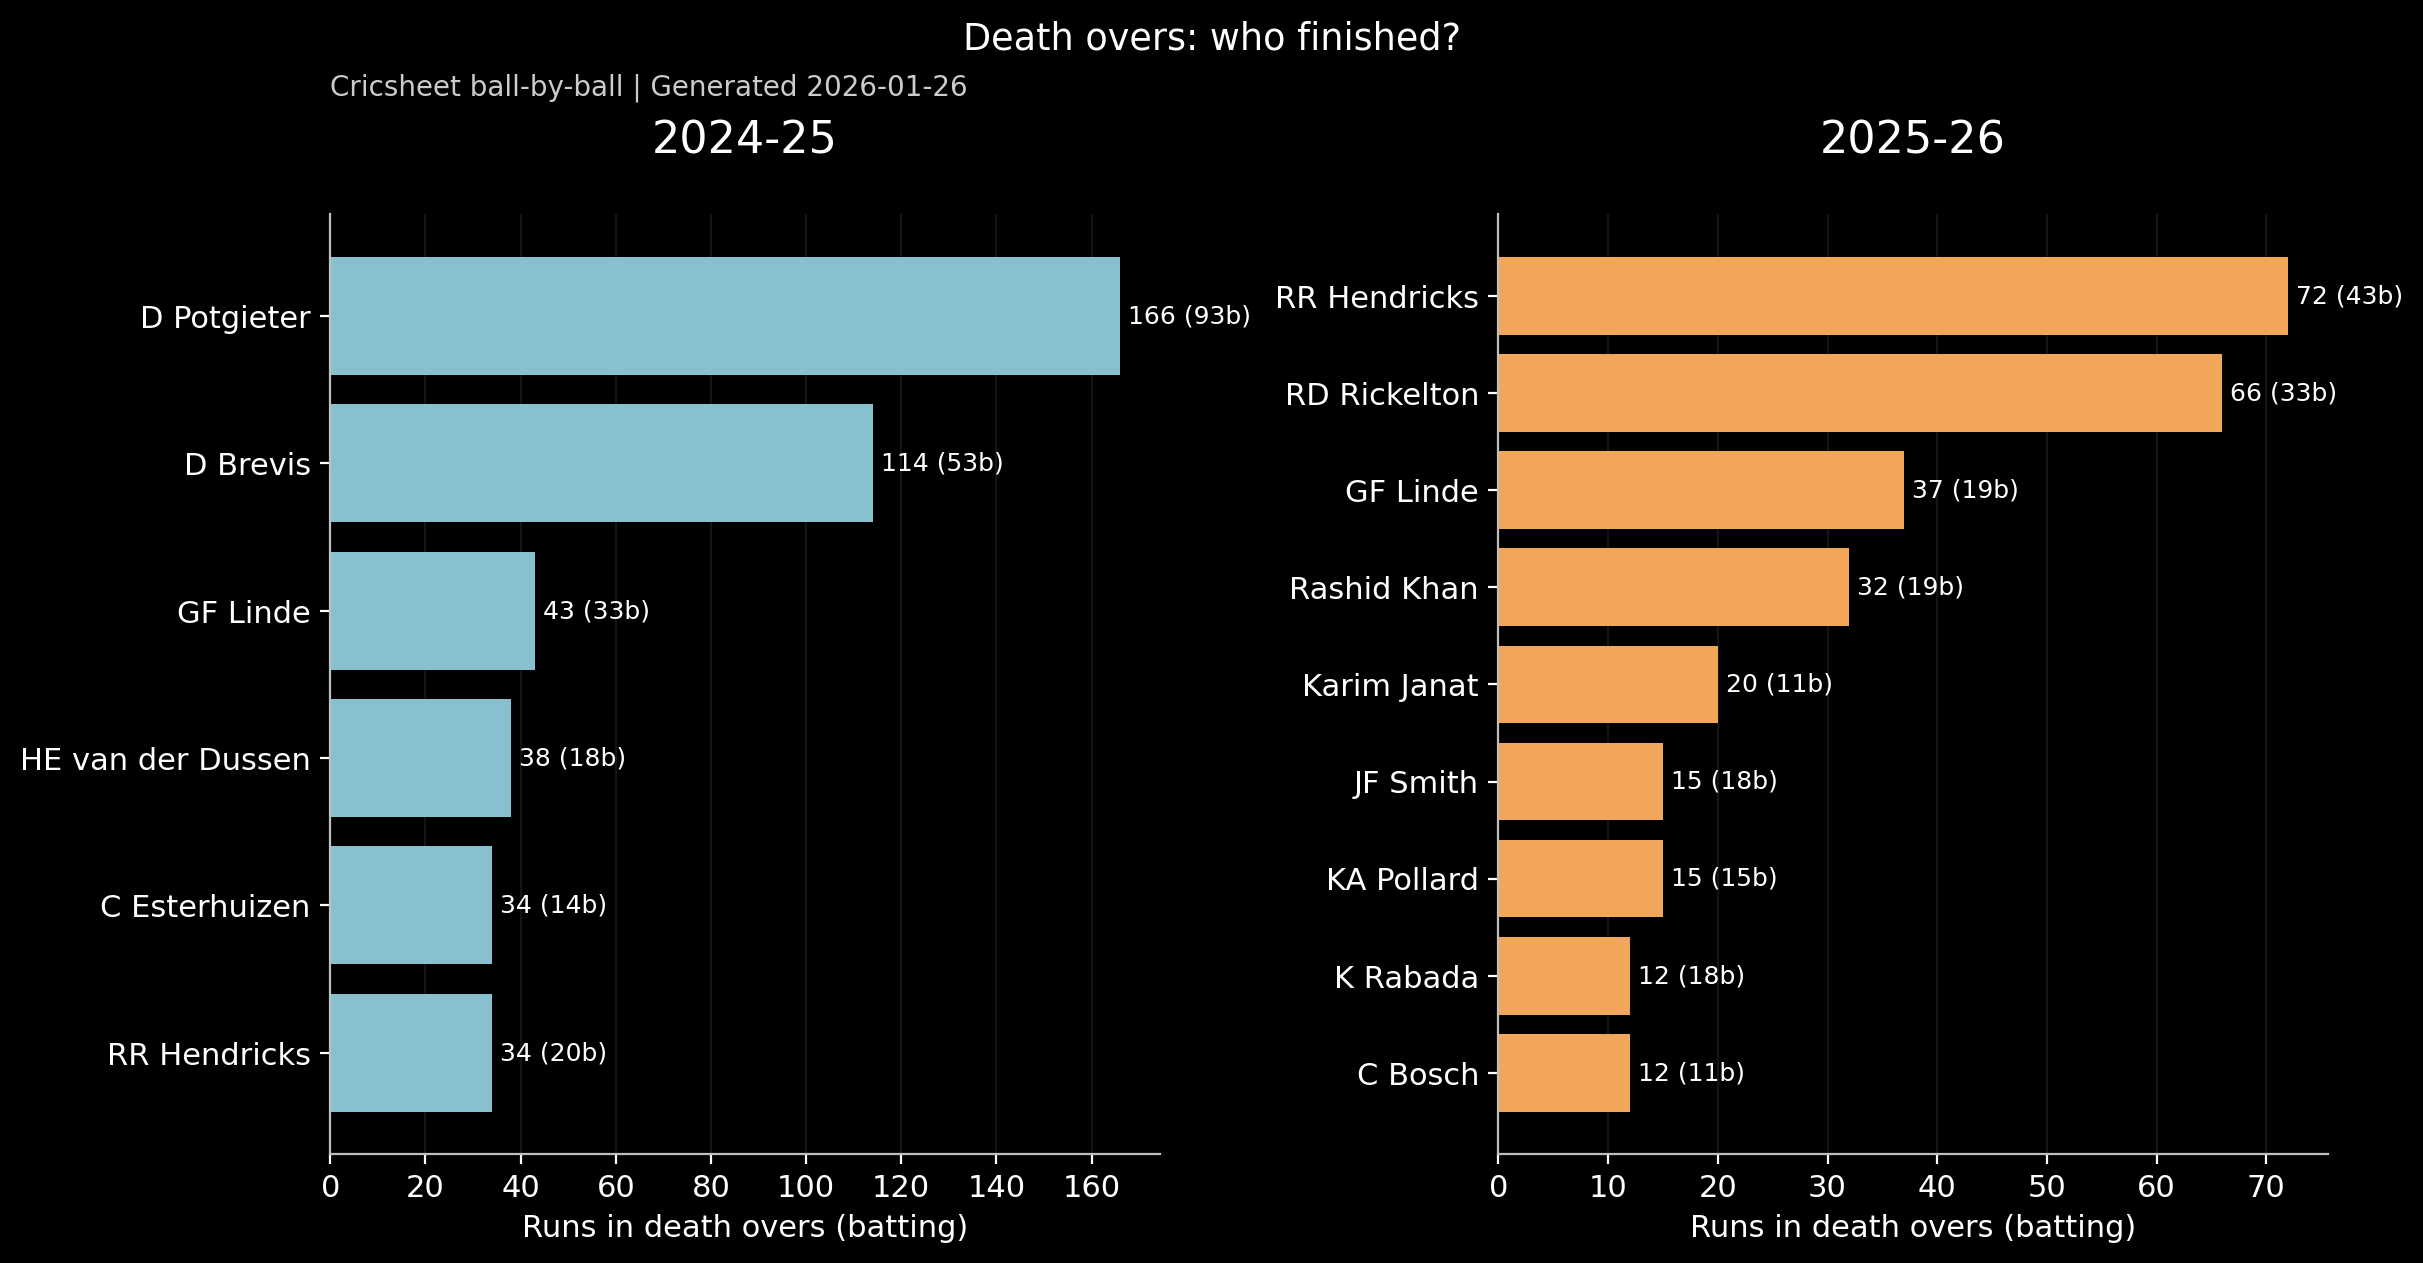
The zoom-in charts make the “why” clearer. Discipline has slipped late, wides are up for key quicks, and those freebies are basically pressure relief valves for the batting side. And the finishing roles have changed too. Last season, MICT had proper closers who owned the death overs. This season that endgame output is flatter, spread thinner, and it shows up in the team-level numbers.
So the drop-off isn’t mysterious. It’s a very T20 problem: lose your finishers, lose your discipline, lose the death overs. The rest of the match starts feeling uphill.
Closing Thoughts
So what now?
First, we’re proud of what we built here. This entire agentic harness went from idea to working pipeline in under a week, and it already does the unglamorous jobs that usually break these projects: pulling the ball-by-ball, curating it, auditing it, running the model, and turning it into visuals you can actually read. The “skills” have matured fast, and the exciting part is we’ve barely scratched the surface of what we can layer on top of this.
But let’s be clear: this is still a living system. As the win-probability model improves, everything around it improves too. Better calibration, better features, cleaner role tagging, sharper insights. The point isn’t a perfect number. The point is a repeatable way to ask better questions, then answer them with receipts.
Key takeaways so far:
- Roles aren’t just coach-speak anymore. “Powerplay enforcer”, “middle-overs surgeon”, “death hitter”, “wicket-taker at the death”, these aren’t vibes. They’re measurable, and once you can measure them, you can recruit for them, balance for them, and stop pretending every batter is competing for the same job.
- “Your best batters must face the most balls” is starting to age out. The modern version is more uncomfortable: your best batters must face the right balls. Some players maximise the powerplay. Others can do the Kohli thing, score fast enough while surviving long enough to carry an innings. And you still need someone who doesn’t panic when the game is on the line, the Dhoni archetype, even if they only face 12 balls. Don’t be surprised if teams start floating certain all-rounders up from seven to four, not because they’ve suddenly become your best pure bat, but to keep your real match-winners and finishers lined up for the moments that decide games.
- Bowlers have roles too, and the phase is the job description. Even in South African conditions, the middle overs have quietly been owned by spinners who don’t need a five-for to bend a chase, they just keep tightening the screws until the batting side blinks. And at the other end, death bowling is still the dark art: the guys who can take wickets late without gifting momentum are worth their weight in sponsor logos. That’s why names like Ottneil Baartman pop in this kind of analysis. Not because they’re flashy, because they’re useful when everything is burning.
That’s the thread running through all of this: impact isn’t just what you did, it’s when you did it, and whether you can do it again next week.